Authored by Arianna Bozzolo, Ph.D.1 and Nathanael Gonzales-Siemens2
1 Director, Rodale Institute California Organic Center
2 Farm Manager, Rodale Institute California Organic Center
Introduction
Biomass production in the hemp plant is known to vary according to the nature of varietal growth and nutritional and environmental conditions. In this respect, removing the terminal main stem bud (topping) is considered an important adjustment for plant geometry. Considerable data have been collected on the effects of fruit structure removal on growth and yield of several annual plants. Kennedy (1991) indicated that prolonged removal of fruiting structures (i.e. flower buds) increased cotton plant size, plant height, number of sympodial branches and fruit set. Ahmed and Abdel-Al (1990) deflowered cotton plants, which showed positive response for plant height, number of inter-nodes and boll weight. Studies have shown that tobacco topping significantly affected the growth and development of the plant including root growth (Qi YC et al., 2012) and leaf quality (Weeks et al., 1986). Additionally, topping alters many biological processes such as carbon and nitrogen metabolism, photosynthesis, and secondary metabolism (Guo HX, 2011). Topping of industrial hemp may increase total plant biomass and flower bud production, leading to greater levels of extractable cannabinoid compounds (Bòcsa et al., 1998), and ultimately improving its value as a medicinal product. Although topping has been used as a cultural practice on a variety of crops, insufficient evidence is available to determine the manner in which pruning impacts hemp plant phenotype and crop load. Therefore, in this study we investigated the effects of topping on industrial hemp growth and biomass production at the Rodale Institute California Organic Center in Camarillo, CA.
Field Study
Materials and Methods
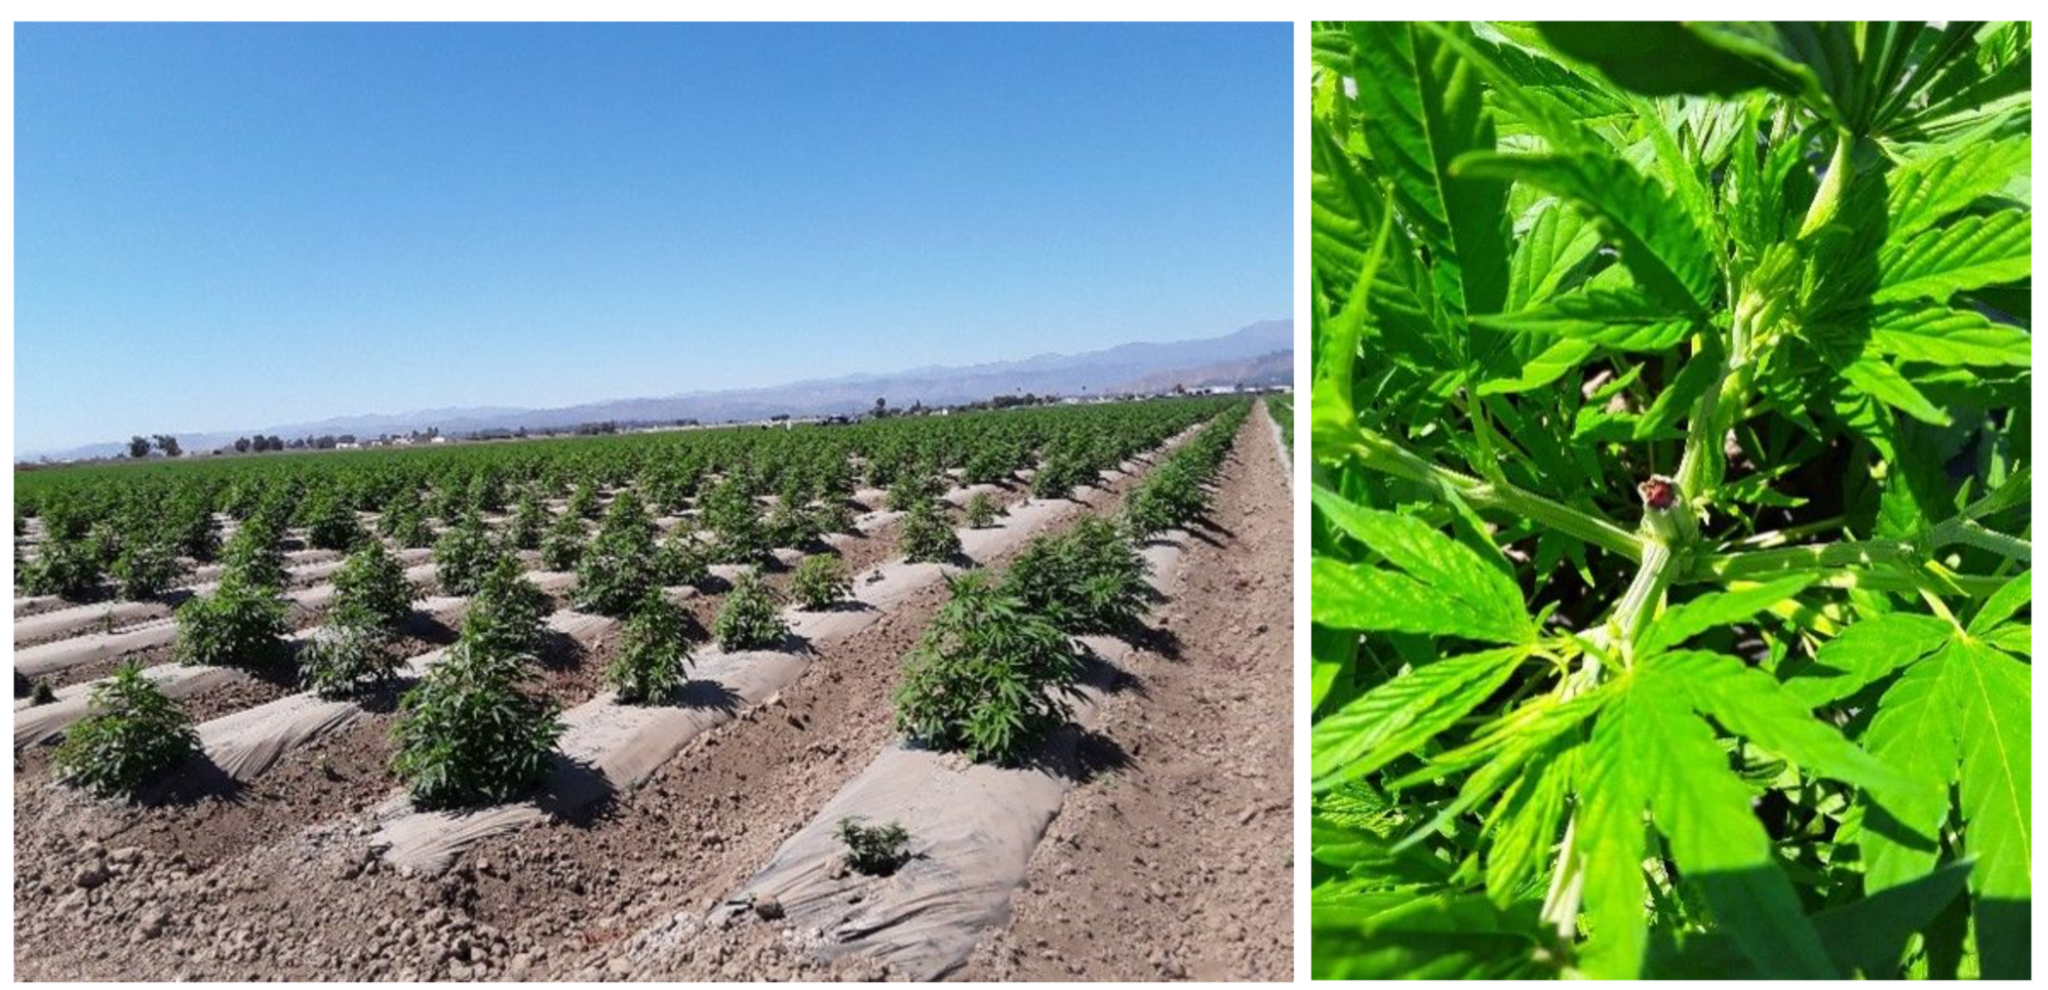
A trial was conducted on a Pacheco silty clay loam soil at the Rodale Institute California Organic Center located at the McGrath Family Farm in Camarillo, CA, to determine the effect of topping on three varieties of industrial hemp for CBD production. Soil was disked and fertilized with 7.5-5-7.5 NPK at 833 lbs/acre. On the 26th of June, beds were formed and black plastic mulch was laid down along with the drip irrigation. Starting from middle of July, the plants were fertilized once a week with a 10-0-0 fertilizer (Ferticell® Explorer) at 2 lbs /gal and a 2-20-2 fertilizer (Ferticell® Active™ NPK) at 2.8 lbs/gal until August 15th. The last three fertilizer applications included a micronutrient fertilizer 1-0-0 (Microelements™ 1-0-0 Ferticell®) at 1 pint/acre. All fertility amendments were approved for use in USDA certified organic systems. On July 10th,seedlings provided by Ventura Seed Company were transplanted in a split-plot design with topping practice as main treatment and varieties as secondary factor with four replicates. Plants were transplanted at a 4 ft by 7 ft spacing, 1556 plants per acre. At the beginning of August, male plants were cut, placed in plastic bags, and removed from the field.
| Location | McGrath Family Farm, Camarillo, CA |
| Previous Crop | Celery |
| Plot Size (ft) | 12 ft x 6.5 ft (14 rows) |
| Seeding Date | 6/22/2020 |
| Transplanting Date | 7/10/2020 |
| Row Spacing | 7 ft |
| Plant Spacing | 4 ft |
| Variety | Days to Maturity |
| Grape Soda | July 11 – Oct 17 (125) |
| Cherry Soda | July 11 – Nov 3 (142) |
| First Frost | July 11 – Sep 27 (107) |
Data collection on plant growth started two weeks after transplant and was repeated at 15-day intervals recording morphological characteristics, such as plant height and number of nodes. Topping practice was performed during the first week of August, removing the apical node of the main shoot (Photo 1).
Plants were harvested according to visual evaluation of inflorescence maturity on September 25th, October 17th and November 3rd for First Frost, Grape Soda and Cherry Soda varieties, respectively. Plants were destructively sampled and total dry weights of above and belowground biomass were measured at harvest. All the data were analyzed using Co-Stat Statistical Software (version 6.201; CoHort Software) with means’ separation performed using the Student-Newman-Keuls test.
Results
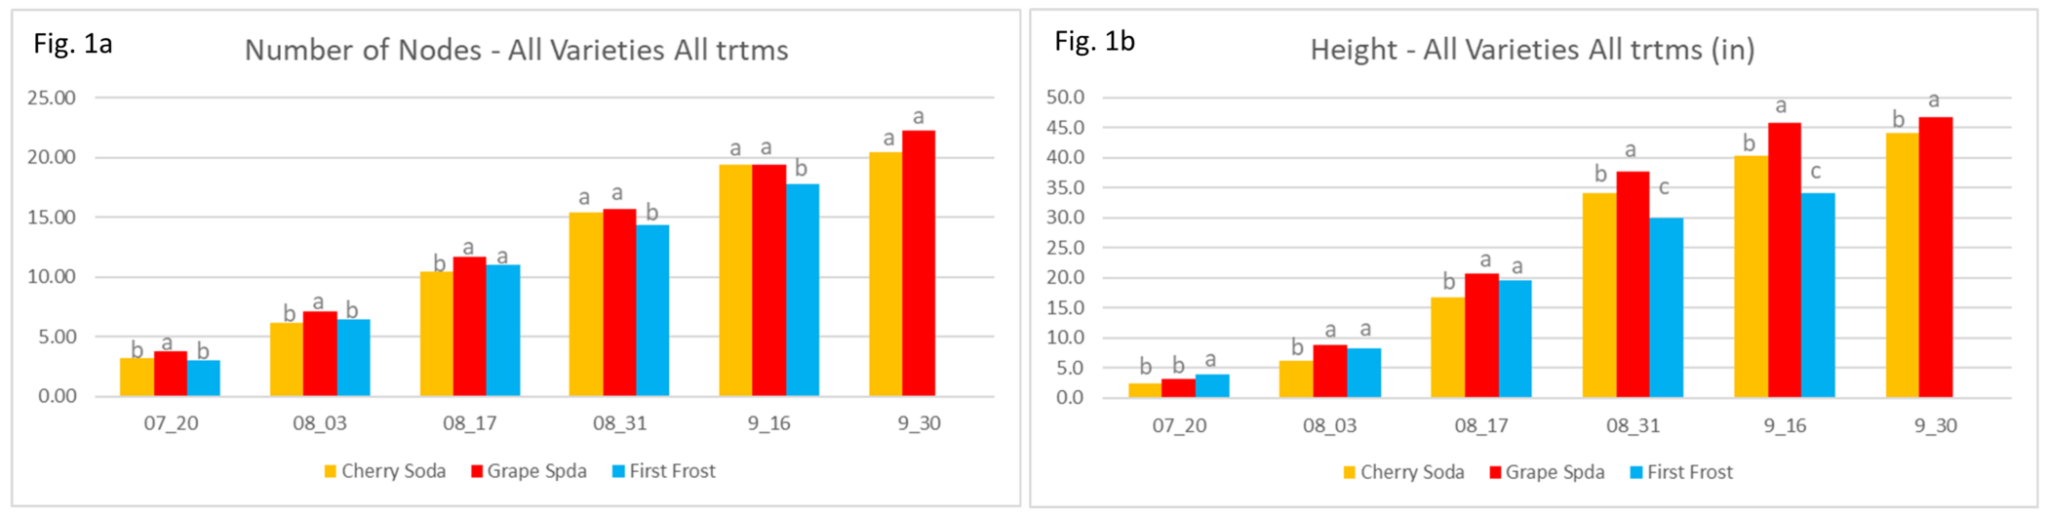
When data were analyzed comparing means by variety for all treatments, Grape Soda showed the greatest number of nodes compares to the other two varieties for the duration of the experiment. Cherry Soda increased the number of nodes during the second part of the season, reaching similar values recorded for Grape Soda. First Frost variety showed a low number of nodes compared to the other two varieties for all sampling dates (Fig.1a). Plant height varied by variety. At the first sampling date, the two Soda varieties had similar heights. Afterwards, Grape Soda showed higher plant height compared to the other two and remained higher until harvest. After the first sampling date, when Cherry Soda and Grape Soda did not show any difference in height, Cherry Soda plant height was significantly lower than both Grape Soda and First Frost, until Aug 17th sampling when Cherry Soda expressed an intermediate phenotype between Grape Soda and First Frost and maintained it until harvest.
First Frost showed the greatest heights compared to Grape Soda and Cherry Soda during the first sampling date; afterwards, First Frost plants had greater heights than Cherry Soda, but similar to Grape Soda until middle of August. Growth slowed down during the second part of the season, ending at harvest with shorter plants compared to the other varieties (Fig.1b).
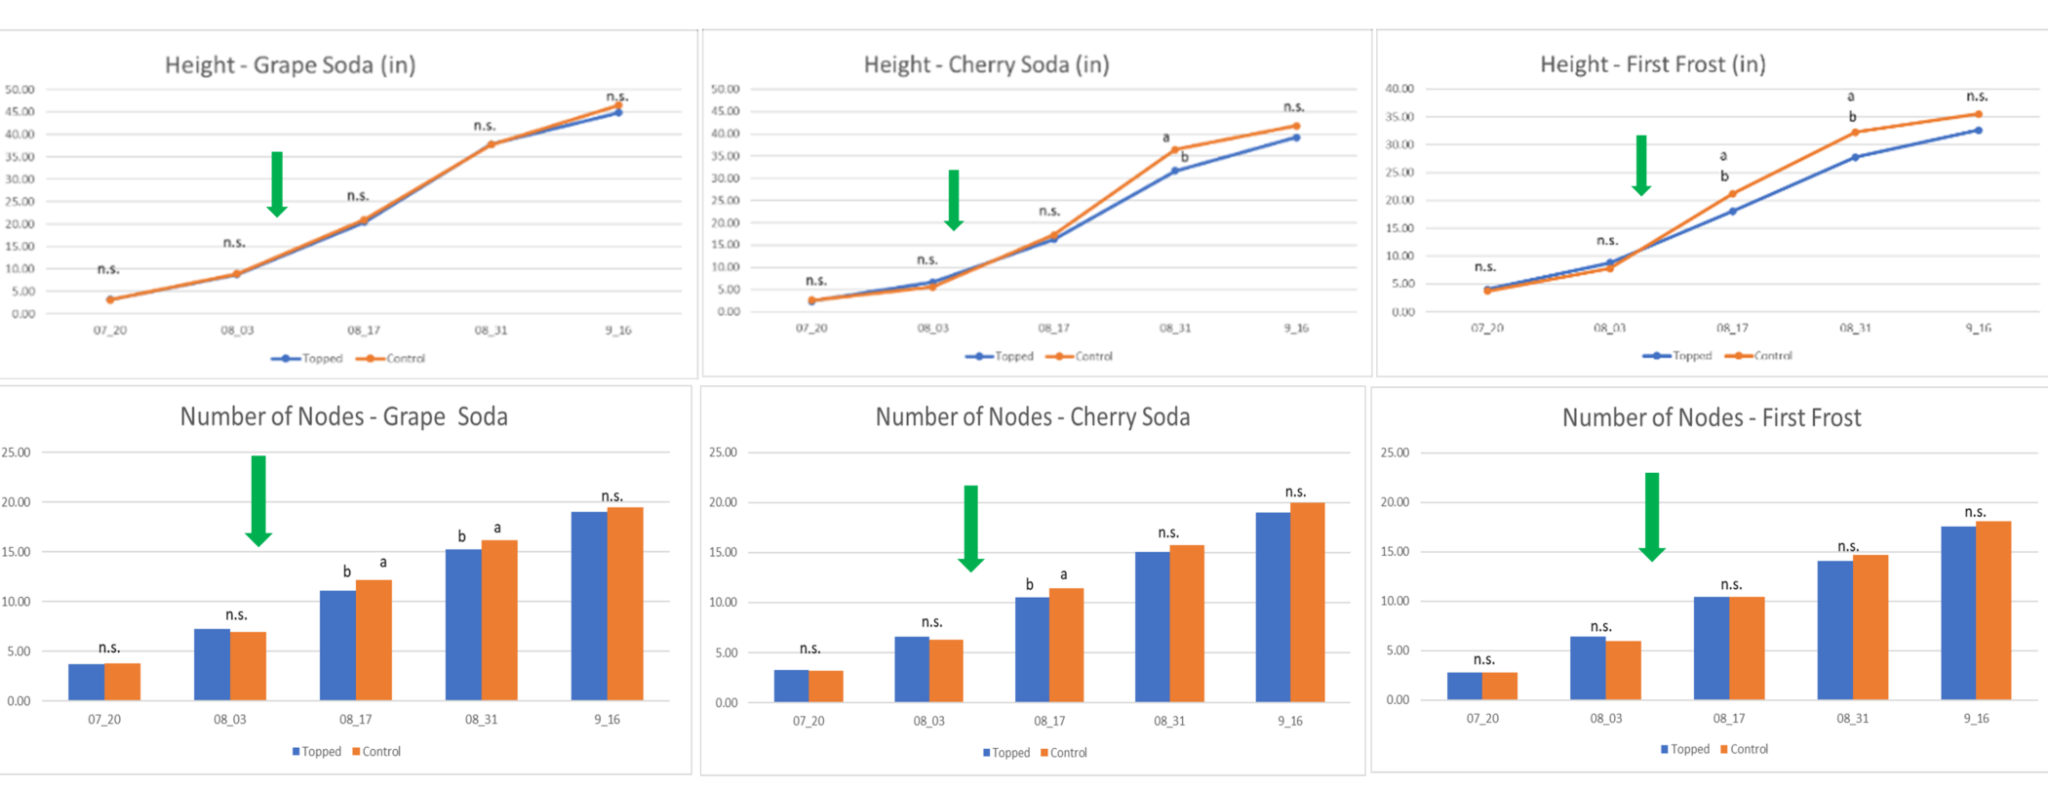
When data were analyzed by variety and treatment, topping reduced overall plant height in First Frost and Cherry Soda during certain sampling dates, but it did not impact Grape Soda height at any time.
Topping effect on number of nodes differed by variety and sampling date. Topping the Grape Soda variety reduced the number of nodes in treated plants during the two sampling dates after pruning, but no differences were shown at harvest.
In Cherry Soda, topping reduced the number of nodes in the treated plants during one sampling date after pruning, and no differences were shown after. The impact of topping on Cherry Soda height was detectable on the sampling date before harvest but not at harvest.
First Frost’s number of nodes did not differ at any time point. Plants’ recovery after pruning required more time compared to the Soda’s varieties: significant differences between treatments were shown during the two sampling dates after the topping cut.
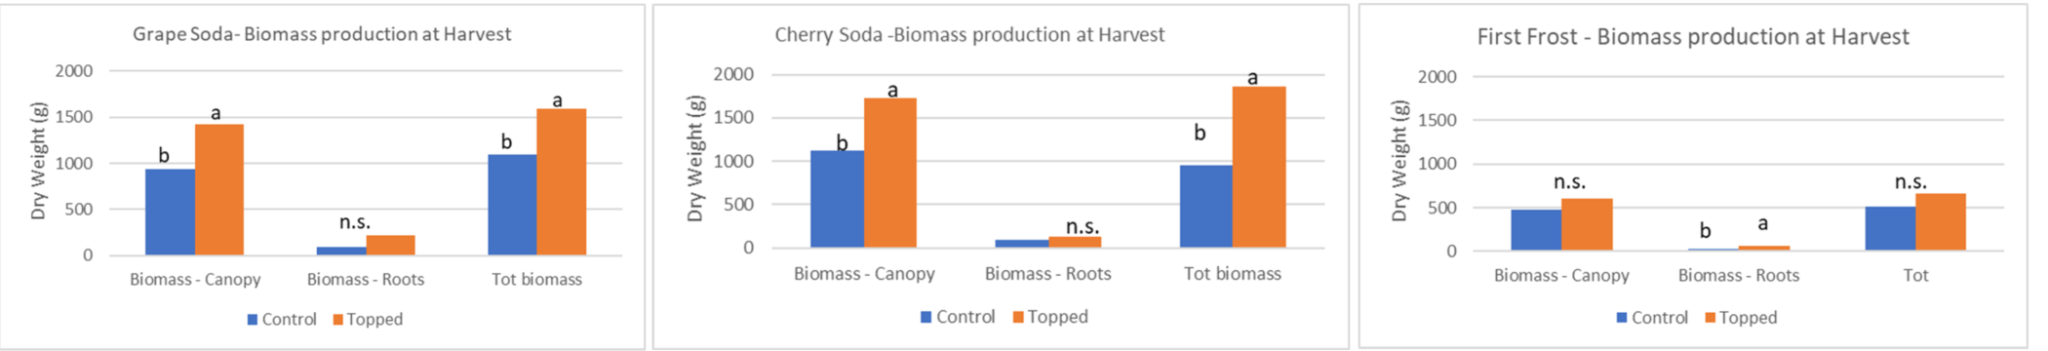
At harvest, Cherry Soda and Grape Soda, either pruned or unpruned, produced a higher aboveground and total biomass compared to First Frost. Grape Soda and Cherry Soda topped plants’ biomass productions at harvest were greater than that of the un-topped control plants. No differences were noticed between treatments for belowground biomass.
First Frost topped plants aboveground biomass production did not differ from the control plants, but root mass production was higher in the topped plants. However, the total biomass production did not differ between treatments (Fig. 3).
Discussion & Conclusion
Pruning cuts that remove growing tips disconnect auxin cytokinin pathways in plants. Shoot tip removal releases dormant growing points, such as lateral and epicormic buds. This new growth requires resources to survive. The newly formed expansion of growth is often at the expense of the root system and overall health of the plant, as the allocation of resources changes dramatically. The ability of a plant to overcome the stress of a cut is revealed by the rapidity with which the plant heals and reestablishes growth, and it is explicated in this experiment by differences or similarities in height between pruned and unpruned plants during the sampling dates after the pruning event. In this research, topping did not decrease plants’ height and number of nodes at harvest for all the varieties.
In this study presented here, growth and production of three industrial hemp varieties after topping pruning practice were reported. It was shown that topping, a form of pruning that removes the apical meristem to promote lateral branching, positively impacted hemp production, increasing plants’ aboveground biomass of Grape Soda and Cherry Soda varieties. The percentage increase of aboveground and total biomass production was equal to 34.9% in topped plants with a production per acre of 1.75 tons, compared to 1.12 tons of unpruned plants. Hence, according to the preliminary results exposed here, it can be recommended to incorporate this canopy management procedure into hemp growing practices for Grape Soda and Cherry Soda production. Aboveground plants’ weight of topped and un-topped First Frost variety did not differ; therefore, a topping practice on this variety is not currently advised.
In this experiment, topping was performed one time only, before flowering. However, the effects of earlier topping dates and frequency of the cut needs to be investigated, as well as the effects of topping on cannabinoid concentrations in the leaf, which ultimately determine the economic value of the crop. Additional analyses will consider the cannabinoid production, cannabinoid profile, economic value, and labor costs associated with topping.